Smarter Balanced Interim Assessment Blocks (IABs) for ELA and Math
Interim Assessment Blocks are available for ELA and Math. These can be further divided into two types: IABs and Focused IABs (FIABs). IABs assess 3–8 academic targets, while FIABs assess 1–3 academic targets. For this user guide, both types of Interim Assessment Blocks are referred to as IABs. There are several ways to view student IAB results in CERS.
IAB/IA Dashboard
The IAB/IA Dashboard is available to users with assigned groups. The IAB/IA Dashboard provides a summary of interim assessments (e.g., CAST IAs, ELPAC IAs, Smarter Balanced ELA IABs, Smarter Balanced math IABs, etc.) taken over the course of a school year for a group of students, including any off-grade assessments taken by a student(s) in the student group. The dashboard also provides an easy way to select these assessments to generate a detailed assessment report. Selecting the [View IAB/IA Dashboard] button on the Assigned Groups panel (figure 1) displays the IAB/IA dashboard (figure 2).
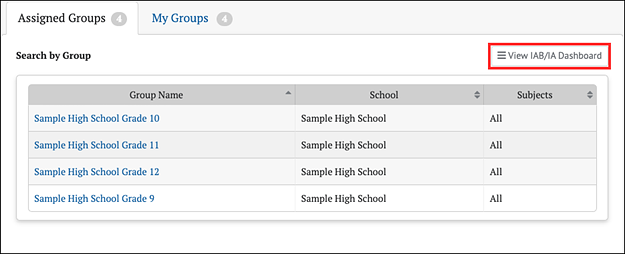
Figure 1. View IAB/IA Dashboard Button
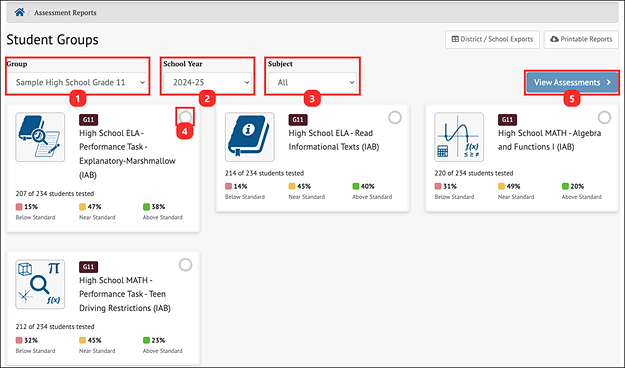
Figure 2. IAB/IA Dashboard
The IAB/IA Dashboard displays a summary of IAB/IA results based on the drop-down menus provided. It identifies the total number of students from the selected group, how many participated in each IAB/IA, and basic performance statistics for each assessment. One or more of these assessments can be selected and used to generate more detailed reports.
- Group drop-down list: Contains all the groups from the Assigned Groups and My Groups panels. This drop-down list defaults to a group belonging to the panel from which the [View IAB/IA Dashboard] button was selected. It may be changed to any group from either Assigned Groups or My Groups.
- School Year drop-down list: Allows a user to select from available school years.
- Subject drop-down list: Can be set to limit the displayed IABs/IAs to a single content area or can be set to All.
- IAB/IA selection indicator: A check mark indicates that the IAB/IA card is selected. Multiple IABs/IAs may be selected at the same time.
- [View Assessments] button: Selecting this button generates assessment reports for all the selected IABs/IAs. It is disabled until at least one IAB/IA is selected.
IAB Results in Group View
The group view provides an aggregate and individual display of a selected assessment for an assigned group, a custom group, or a school. Refer to the View Student Assessment Results by School and Grade section or the View Student Group Assessment Results section for details.
Once a user selects an IAB to display in the group view, the Results panel for the selected Interim Assessment Block (IAB) will appear (figure 3).
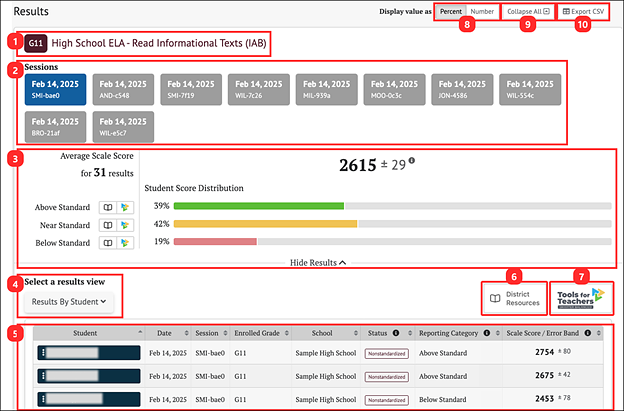
Figure 3. IAB Results in Group View
The Results page for IABs displays the following information and elements:
- Name and grade level of the assessment
-
Sessions: Testing session(s) from which results are displayed. These sessions appear once a test is completed and scored. Please note that testing sessions appear here for interim assessments only and are available to Teachers and School Administrators after selecting a student group from the Assigned Groups and My Groups panel.
- Group Aggregate panel displays aggregate data for the selected groups of sessions
- Select a results view drop-down menu offers the following options for display results:
- [Results By Student] (default view)
- [Results By Item]
- [Key/Distractor Analysis] (for selected-response items)
- [Writing Trait Scores] (for ELA Performance Tasks only)
- Results View table
- [District Resources] button: Includes a link to resources an administrator has provided.Refer to the District Resources section for more information.
- [Tools for Teachers] button: Includes a link to the Tools for Teachers website. For most assessments, the link is connected to the Tools for Teachers website home page. For ELA and math IABs/FIABs, the link is connected to the related Connections Playlist. Refer to the Tools for Teachers section for more information
- Display value as field: Contains a toggle allowing a user to change the display to show the Student Score Distribution in percentages or numbers of students in each reporting category
- [Collapse All] button: Hides the Results View table for all the displayed assessments and toggles to an [Expand All] button that displays the results again
- [Export CSV] button: Export all the student’s test history to a comma-separated value (CSV) file for download.
IAB Group Aggregate Results
The IAB group aggregate results panel (figure 4) reports one overall performance score for the selected assessment sessions. For overall scores, the Student Score Distribution reports three reporting categories. For ELA and math IABs, the reporting categories are Above Standard, Near Standard, and Below Standard.
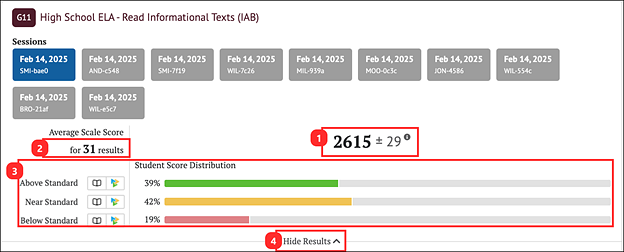
Figure 4. Overall Group Results for an IAB
The Group Aggregate panel for IABs/IAs displays the following information and elements:
- Average Scale Score: Average scale score for the selected group of students and an error band based on the Standard Error of the Mean
- Number of student test results from which the average scale score and score distribution are calculated
- Student Score Distribution: Score distribution for the performance levels of the overall score
- [Show Results] button: Displays the Results View table for the displayed assessment and toggles to a [Hide Results] button that can hide the table
IAB Results by Student
When the Results By Student view is active, the IAB results page shows a table with each row displaying a student’s assessment results. The table has sortable columns and additional information icons (figure 5).
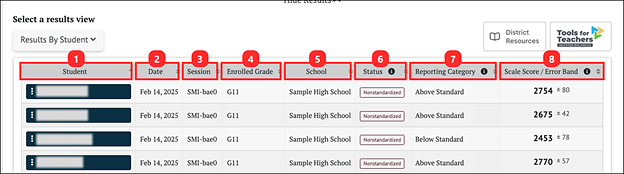
Figure 5. IAB Results By Student
The table includes the following information for each student:
- Student: Student’s full name with a Context Menu three-dot icon [⋮] allows a user to access a pop-up menu that allows further selections of student details to be made (refer to IAB Student Options section)
- Date: Date student completed assessment
- Session: Testing session identifier
- Enrolled Grade: Student’s enrolled grade at the time of the assessment
- School: Student’s assigned school at the time of the assessment
- Status: The assessment status, which includes whether the assessment administration (Manner of Administration) was Standardized or Non-standardized, or if the assessment was marked Partial or Complete (Completeness)
- Reporting Category: The score reporting category, which is Below Standard, Near Standard, or Above Standard.
- Scale Score/Error Band: The student’s scale score on the assessment and the error band based on the Standard Error of Measurement (SEM) associated with that student’s score.
IAB Student Options
When the Context Menu three-dot icon [⋮] next to a student’s name is selected, the Student Options pop-up menu opens (figure 6).
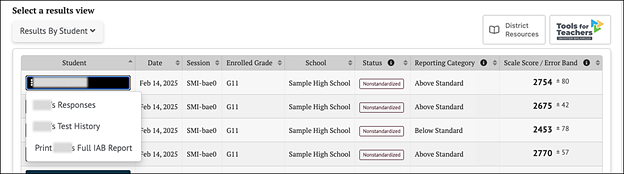
Figure 6. Student Options Context Menu
The menu options are:
- [Student’s Responses]: This displays the student’s responses to each item on the assessment. Refer to the Student Responses for Interim Assessments section for details.
- [Student’s Test History]: This displays the test history of the student. Refer to the Student Test History Report section for details.
- [Print Student’s Full IAB Report]: This links to a printable Individual Student Report (ISR) in PDF format. Filter selections are automatically filled for some fields, such as the assessment type, subject, and school year. Refer to the Printable Reports section for details.
IAB Results by Item
When the Results By Item view is active, the panel shows a results table with an aggregate view of how the students performed on each item. The table has sortable columns and additional information icons (figure 7).
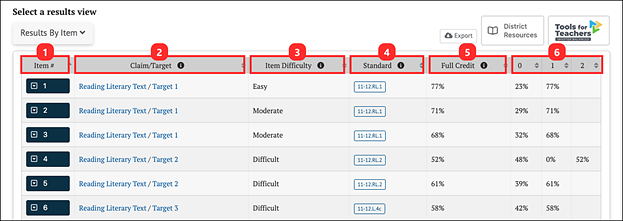
Figure 7. IAB Results By Item
The data shown in the Results By Item view indicates how the students performed on each assessment item:
- Item #: Number of the item in the order it was presented to the student
-
Claim/Target: Topic area and particular knowledge and skills tested by the item
-
Item Difficulty: Item difficulty (easy, moderate, or difficult) based on the item's difficulty for students in a reference population
- Standard: Content standard that defines what students should know, understand, and can do
- Full Credit: Percentage or number of students in the selected group who earned the maximum number of points for the item
- 0, 1, 2, 3, etc. : Percentage or number of students who earned each possible score-point level on the item
Users may sort by each of these categories of information to quickly identify items of interest. Additionally, an [Export] button is available to export the Results By Item view to a CSV file.
IAB Results by Item Details
Selecting an assessment item’s drop-down arrow icon [⌄] expands the row to reveal additional details about that item (figure 8).
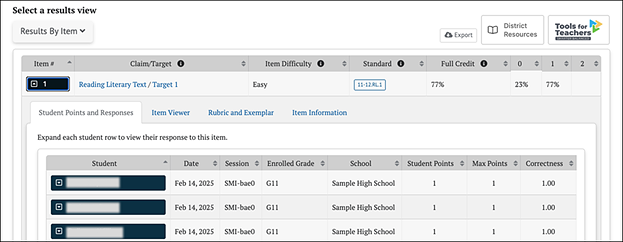
Figure 8. IAB Results By Item Additional Details
Student Points and Responses
The [Student Points and Responses] tab lists each student in the selected session(s) and the points earned by the student for each item (figure 8). It displays each student’s name, test date and session identifier, enrolled grade, and school. The report includes the number of points the student earned on the item, the maximum points available for the item, and the correctness of the student’s response, which is the ratio of the student’s points to the maximum points. For example, a student who earned one point out of a maximum of two points would have a correctness value of 0.50.
Selecting the drop-down arrow icon [⌄] next to a student’s name displays the view of the item as seen while taking the assessment, including the student‘s response (figure 9). The item number is shown at the top left for the item being viewed. This view is read only; there are no user-editable fields.
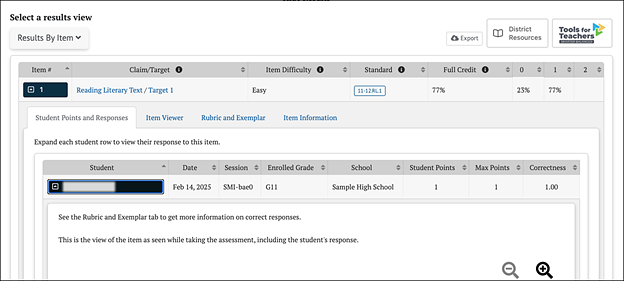
Figure 9. Student Points and Responses Tab
Item Viewer
The [Item Viewer] tab displays the assessment item as it appeared on the test but does not show the student’s response. The item number is shown at the top left for the item being viewed. This view is read only; there are no user-editable fields. An example Item Viewer panel is shown in figure 10.
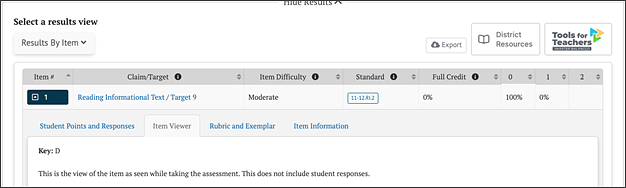
Figure 10. Item Viewer Tab
Rubric and Exemplar
The [Rubric and Exemplar] tab displays the answer key, or an exemplar, and the rubric for the assessment item (figure 11).
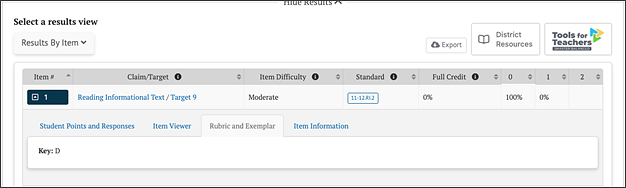
Figure 11. Rubric and Exemplar Tab Displaying the Key
The Rubric and Exemplar tab provides the correct answer and, in some cases, multiple correct answers. For selected response test items (e.g., multiple-choice, multiple-select, or evidence-based selective response items), a Key (answer key) is shown.
The Rubric can also describe the point values associated with specific responses (figure 12).
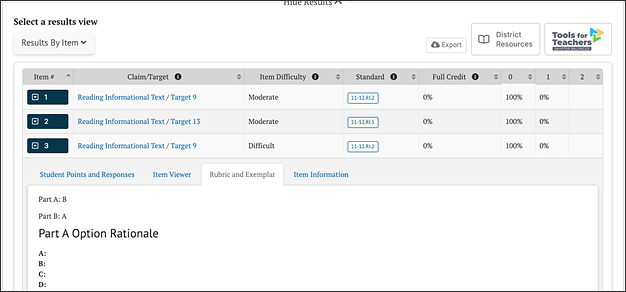
Figure 12. Rubric and Exemplar Tab Displaying the Rubric
Item Information
The [Item Information] tab displays a detailed description of the assessment item (figure 13).
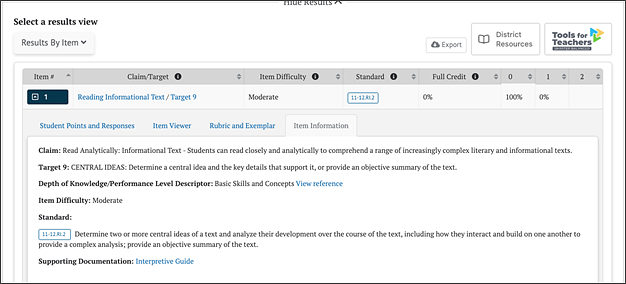
Figure 13. Item Information Tab
Elements shown in the Item Information view may include:
- Claim: Major topic area of the test item content
- Target: Particular knowledge and skills measured by the test item
- Depth of Knowledge (DOK)/Performance Level Descriptor: Level of cognitive demand this test item requires; includes a link to the DOK resource
- Item Difficulty: One of three possible values: Easy, Moderate, Difficult
- Standard: Content standard(s) that defines what students should know, understand, and can do
- Calculator: For mathematics and science questions, as appropriate, this element indicates if an embedded calculator was available to students completing this item.
- Supporting Documentation: Link to the CERS Interpretive Guide
Key/Distractor Analysis
The Key/Distractor Analysis view provides an answer key with a feature that allows the user to evaluate whether there may have been common areas of misunderstanding among students who chose incorrect answers, called “distractors.” This feature is only available for selected-response (multiple-choice and multiple-select) items for interim assessments.
When the Key/Distractor Analysis view is active, the Results panel shows an aggregate view similar to that of the Results By Item table, but with the percent distribution of student responses by answer option (figure 14).
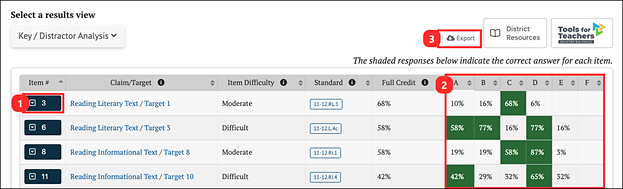
Figure 14. Key/Distractor Analysis Results
The Key/Distractor Analysis table appears as described in the IAB Results by Item section (figure 7), with the following differences:
- [Item drop-down arrow] icon: Selecting an item’s down-arrow icon [⌄] expands the row to reveal additional details. Refer to the IAB Results by Item Details section.
A, B, C, etc.: The percentage or number of students who selected each answer choice. The correct answers are highlighted in green.
- [Export] button: Exporting is available to export the results of the report to a CSV file
IAB Writing Trait Scores
Writing trait scores are displayed for ELA performance task IABs that include a writing extended response (essay) item.
When the Writing Trait Scores view is active, the Results panel shows a table with an aggregate view of how the students performed on the writing extended response item. Only items with writing trait information are listed (figure 15).
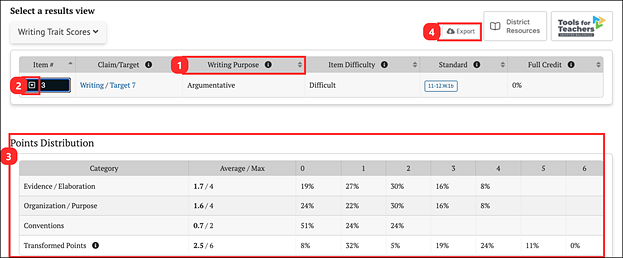
Figure 15. Writing Trait Scores View
The Writing Trait Scores Item table is like the IAB Results By Item table, with the following differences:
- Writing Purpose: Displays the purpose of the writing tasks (Argumentative, Explanatory, Informational, Narrative, or Opinion).
- [Item drop-down arrow] icon: Selecting an item’s drop-down arrow icon [⌄] expands the row to allow viewing of the item and additional information about the item (refer to the IAB Results by Item Details section).
- Points Distribution table:
- Category: Rows list the category of writing performance or writing trait (Evidence/Elaboration, Organization/Purpose, and Conventions)
- Average/Max: The average and maximum points earned by students in the group for that category.
- 0, 1, 2, 3, etc. : Percentage or number of students who earned each number of points for that category.
- Transformed Points: The final row is for the transformed points calculated from all categories (refer to the CERS Interpretive Guide for an explanation of how transformed points are calculated for Writing Extended Response items).
- [Export] button: Exporting is available to export the report results—both the Results By Item table and the Points Distribution table combined—to a CSV file.