Creating the Custom Aggregate Report
The report can be generated by selecting the [Create Report] button on the left side of the Custom Aggregate Report Query page, as shown in figure 1. The button is also available on the Report Preview Reference panel.
![the [Create Report] button.](/s/cers-guide/custom-aggregate-reports/creating-custom-aggregate-report/2025-9e-image012.png)
Figure 1. [Create Report] Button
When this button is selected, a Custom Aggregate Report is created, and when completed, the report is displayed on the Custom Aggregate Report page, shown in figure 2. When the report is too large, it is only available on the My Reports page for download.
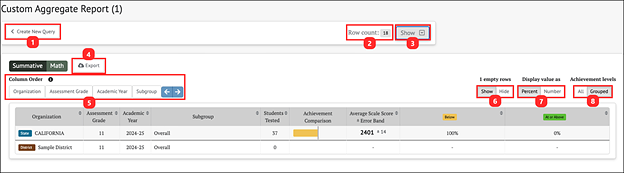
Figure 2. Custom Aggregate Report
The Custom Aggregate Report page has the following features and options:
- [Create New Query]: Returns the user to the Custom Aggregate Report Query page with the same settings used to generate this report. From here, the settings can be modified and used to generate a new report.
- Row count: Indicates the total number of rows displayed in the report. It is not possible to generate a report that contains zero rows. Instead, a message indicating that no results are available is displayed.
-
[Show/Hide]: Toggle displays whether a panel listing the settings in the query is displayed. When [Show] is selected, the query settings will display and the option to [Hide] becomes available as shown in figure 3.
![Custom Aggregate Report using the [Hide] button.](/s/cers-guide/custom-aggregate-reports/creating-custom-aggregate-report/2025-9e-image014.png)
Figure 3. Query Options
-
[Export]: Generates a CSV file with the contents of the report (figure 4). The columns are the same as displayed on the page, with one additional column: The Organization’s Natural Id (Column B), also known as the CDS code.
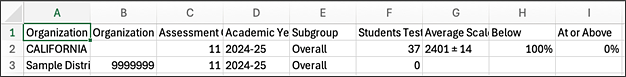
Figure 4. Custom Aggregate Report CSV Export
- Column Order: Allows the option to change the column order to compare results broken down in different ways
- Empty rows: When the [Show] button is selected, rows with no data are included in the report. When the [Hide] button is selected, the empty rows are excluded from the report. If a report section has only empty rows, the entire section is excluded.
- Display value as: Allows the option to change the score level distributions between [Percent] or [Number]. The toggle is not available for the Target Report.
- Achievement levels: Choices are either [All] or [Grouped]. If [All] is chosen, all achievement level distributions are displayed in the report. If [Grouped] is chosen, then achievement levels below the standard cutoff are combined into one result, labeled Below Standard, and achievement levels above the standard cutoff are combined into one result, labeled At or Above Standard. The toggle is only available for the Yearly Report and the Longitudinal Report.